-
Text Color


-
Text Size


-
Contrast


INTRODUCTION
This report is the first attempt by the Department of Statistics, Malaysia to publish data on Gross Domestic Product (GDP) by Income Approach. The statistics are presented in current prices for the period of 2005 to 2013 which consists of income components namely Compensation of Employees (CE), Gross Operating Surplus (GOS) and Taxes less Subsidies on Production and Imports.
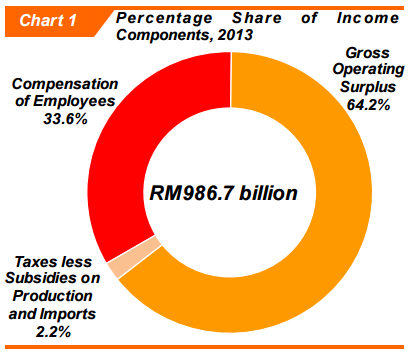 |
ECONOMIC PERFORMANCE 2013 Malaysia’s economy in current terms recorded a value of RM986.7 billion in 2013 impelled by Services and Manufacturing. As illustrated in Chart 1, CE contributed 33.6 per cent (RM331.4 billion) while GOS accounted for 64.2 per cent (RM633.9 billion). Taxes less Subsidies on Production and Imports contributed 2.2 per cent (RM21.5 billion) to the economy |
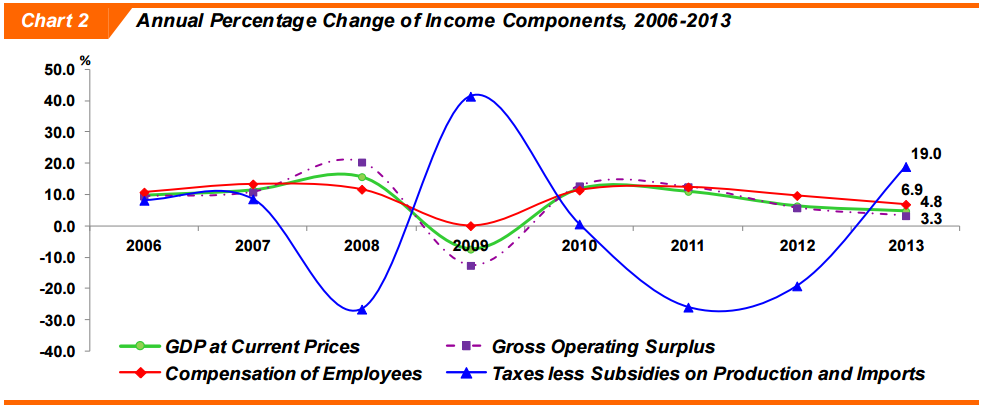
In terms of growth, GDP grew 4.8 per cent (Chart 2). All sectors registered a moderate performance except for Agriculture which remained sluggish following the lower commodity prices in 2013. As a consequence, GOS eased to 3.3 per cent while CE expanded 6.9 per cent. Nonetheless, Taxes less Subsidies on Production and Imports rebounded to 19.0 per cent from the negative 19.2 per cent in 2012.
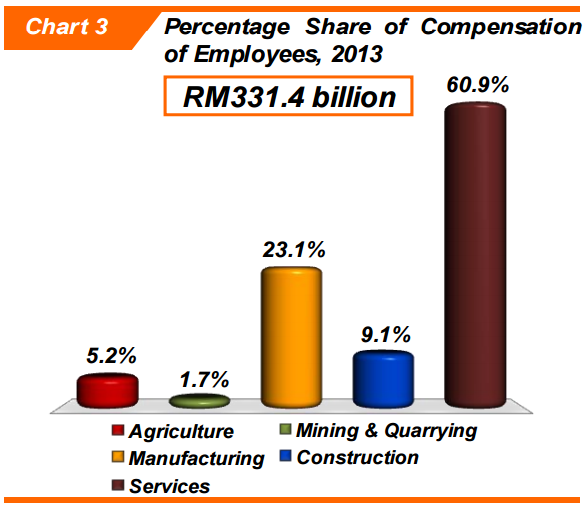 |
COMPENSATION OF EMPLOYEES BY SECTOR 2013 As the largest contributor to GDP, Services accounted for 60.9 per cent to the total CE followed by Manufacturing at 23.1 per cent as shown in Chart 3. Construction was the third largest contributor with a share of 9.1 per cent while Agriculture contributed 5.2 per cent. Meanwhile, the lowest share was recorded by Mining & Quarrying at 1.7 per cent. |
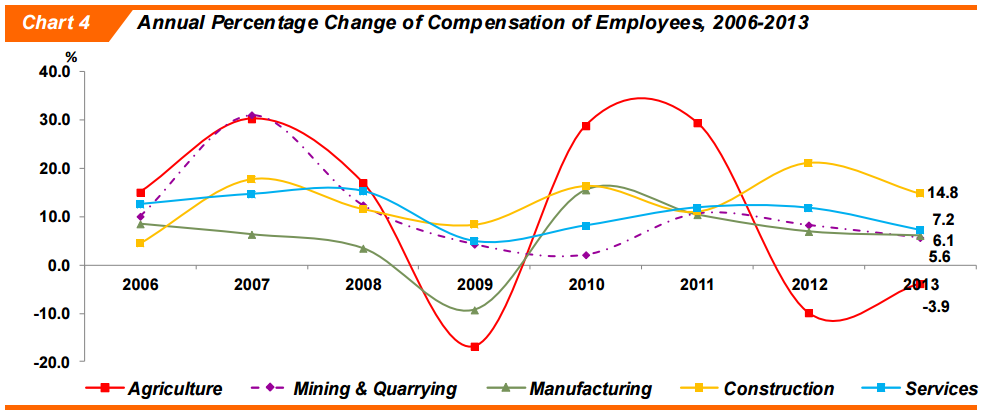
In 2013, CE expanded 6.9 per cent largely supported by Services and Manufacturing sector. As depicted in Chart 4, CE of Services increased 7.2 per cent propelled by Wholesale & Retail Trade, Accommodation and Restaurants (9.8 per cent) as well as Finance, Insurance, Real Estate and Business Services (9.2 per cent).
Concurrently, Manufacturing rose by 6.1 per cent backed by Electrical & Electronic products which registered a growth of 5.7 per cent in 2013. CE of Manufacturing was also buoyed up by the double-digit growth of 13.0 per cent in Transport Equipment & Other Manufactures precisely by motor vehicles and ship building activities.
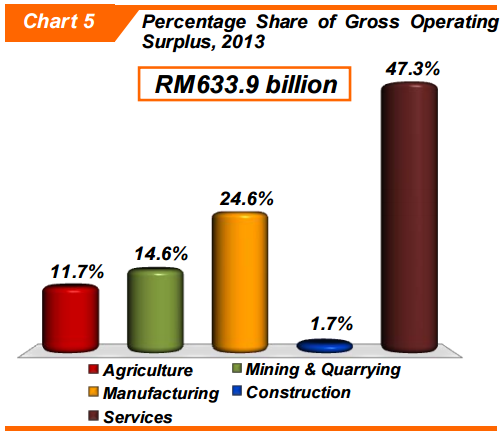 |
GROSS OPERATING SURPLUS BY SECTOR 2013 GOS accounted for 64.2 per cent to the total economy in 2013. As illustrated in Chart 5, Services contributed the largest share of 47.3 per cent followed by Manufacturing at 24.6 per cent. In addition, Mining & Quarrying and Agriculture contributed 14.6 per cent and 11.7 per cent respectively. Meanwhile, Construction posted the lowest contribution with a share of 1.7 per cent. |
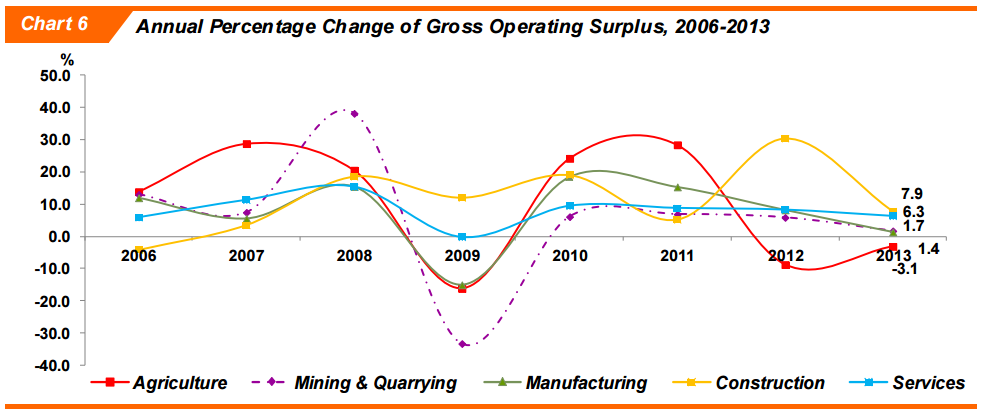
The moderation of the economy in 2013 has impacted the GOS to register a slower pace of 3.3 per cent attributed by Services and Manufacturing. GOS in Services increased to 6.3 per cent from 8.3 per cent in 2012 (Chart 6) supported by the expansion of 7.6 per cent in Wholesale & Retail Trade, Accommodation and Restaurants.
Moreover, Manufacturing grew 1.4 per cent led by the robust growth of 15.3 per cent in Transport Equipment & Other Manufactures. Nevertheless, declined in Petroleum, Chemical, Rubber & Plastic products (-0.2 per cent) has weighed down the GOS of Manufacturing in 2013.
Gross Domestic Product Income Approach 2005-2013 
Released by:
THE OFFICE OF CHIEF STATISTICIAN MALAYSIA
DEPARTMENT OF STATISTICS, MALAYSIA
21 JULY 2014

 Contact Us
 FAQs
FAQs Feedback
 Sitemap