Natural Rubber (NR) production decreased by 7.6 per cent in February 2023 (27,209 tonnes) as compared to January 2023 (29,451 tonnes). Year-on-year comparison showed that the production of NR decreased by 2.7 per cent (February 2022: 27,950 tonnes).
Release Date : Wednesday 12, April 2023 1200
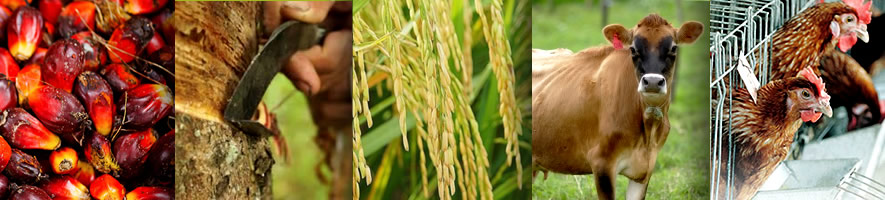
The Annual Economic Statistics (AES) Agriculture Sector, displays the performance of economic sector consist of 4 sub-sectors namely sub-sector of crops, livestock, forestry & logging and fisheries.
Release Date : Tuesday 28, February 2023 1200
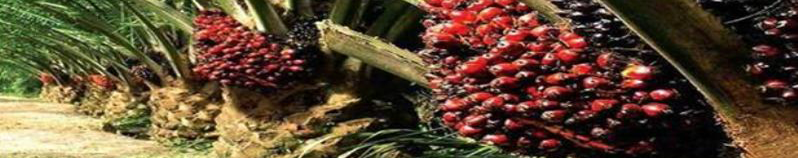
The production of four major commodity crops, namely fresh fruit bunches (oil palm), natural rubber, kenaf (dried stem) and cocoa beans, in 2021 showed a decreasing trend as compared to 2020. Though the production of fresh fruit bunches (oil palm) was the highest among the agricultural commodities, its production decreased by 5,575.6 thousand tonnes with 5.7 per cent as compared to previous year.
Release Date : Tuesday 25, October 2022 1200
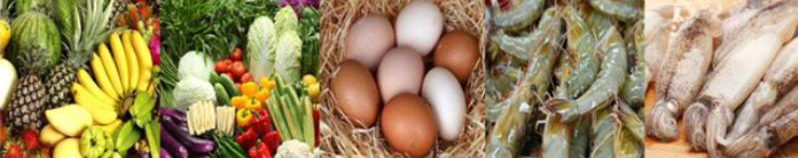
26 selected agricultural items recorded Self-Sufficiency Ratio (SSR) 100 per cent and more
Release Date : Monday 12, September 2022 1200
In 2015, the production of natural rubber was 722,122 tonnes as compared to 939,241 tonnes in 2010 with an annual growth rate of -5.1 per cent. Smallholding sector was the main contributor to the production of natural rubber at 665,301 tonnes or 92.1 per cent of the total production while 7.9 per cent was from estate sector.
Release Date : Thursday 30, November 2017 1200
In 2015, number of establishments involved in the fisheries sub-sector was 1,229 establishments. Gross output value was RM2,226.0 million or 3.0 per cent from total gross output of the agriculture sector with value added of RM747.6 million. This sub-sector also provides job opportunities to 15,690 people with salaries & wages paid amounting RM315.0 million.
Release Date : Monday 07, August 2017 1200
In 2015, number of establishments involved in the forestry and logging sub-sector was 766 establishments. Gross output value was RM7,552.2 million or 10.2 per cent from total gross output of the agriculture sector with value added of RM3,006.0 million. This sub-sector also provides job opportunities to 26,034 people with salaries & wages paid amounting RM737.3 million.
Release Date : Monday 07, August 2017 1200
In 2015, number of establishments involved in the crops sub-sector was 8,029 establishments. Gross output value was RM50,763.3 million or 68.7 per cent from total gross output of the agriculture sector with value added of RM34,309.5 million. This sub-sector also provides job opportunities to 368,002 people with salaries & wages paid amounting RM6,125.8 million.
Release Date : Monday 10, July 2017 1200
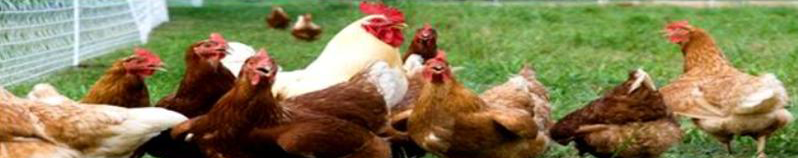
In 2015, number of establishments involved in the livestock sub-sector was 1,604 establishments. Gross output value was RM13,312.1 million or 18.0 per cent from total gross output of the agriculture sector with value added of RM3,410.3 million. This sub-sector also provides job opportunities to 34,805 people with salaries & wages paid amounting RM726.2 million.
Release Date : Monday 10, July 2017 1200


 Contact Us
 FAQs
FAQs Feedback
 Sitemap