-
Text Color


-
Text Size


-
Contrast


Headline Inflation
The implementation of Movement Control Order (MCO) 2.0 and 3.0 in early and mid-2021 has caused the inflation rate to increase significantly to 2.5 per cent as compared to 2020, negative 1.2 per cent. The inflation rate increased to the highest level of 4.7 per cent in April 2021 as a result of the lower base effect last year, which recorded a significant increase mainly by the group of Transport as well as an increase in the prices of miscellaneous goods.

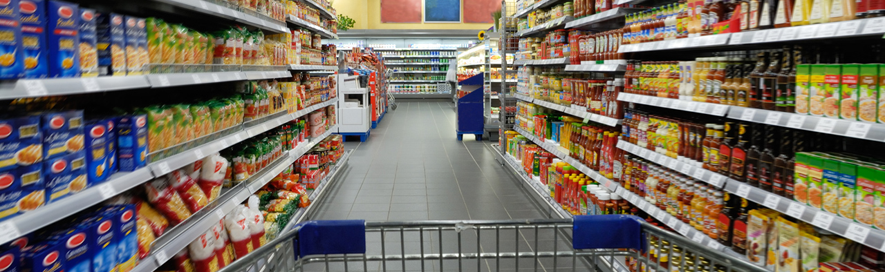
Overall, the 2.5 per cent increase was contributed by the index of Transport (11.0%); Food & Beverages (1.7%); Furnishings, Household Equipment & Routine Household Maintenance (1.6%) and Housing, Water, Electricity, Gas & Other Fuels (1.5%) contributed 72.0 per cent to the total weight of Consumer Price Index (CPI). Meanwhile, the core inflation was slower at 0.7 per cent as compared to 1.1 per cent recorded in the previous year.

In 2021, all subgroups of Food & Beverages recorded increases between 0.3 per cent to 3.3 per cent. The subgroup of Oils & fats was the main contributor to the increase of this group which inclined of 3.3 per cent. This was followed by the increase in Meat (3.2%); Fish & seafoods (3.1%); Milk, cheese & eggs (2.3%); Food products not else where classified (2.3%) and Vegetables (2.1%). (Table 1)
Furthermore, inflation for urban in 2021 inclined 2.4 per cent as compared to negative 1.1 per cent recorded in the previous year. Inflation in rural areas increased 2.6 per cent in 2021 as compared to negative 1.5 per cent in 2020. Inflation for the income group below RM3,000 increased 2.2 per cent in 2021 as compared to 2020 (-1.0%).

In 2021, all states registered increases in inflation while seven states showed increases which surpassed the national inflation level of 2.5 per cent. The highest increase was recorded by Terengganu (3.4%). Meanwhile, Wilayah Persekutuan Kuala Lumpur (2.0%) and Sabah & Wilayah Persekutuan Labuan (1.6%) were the two states with the lowest increase. All states registered an increase in the inflation of Food & Beverages. The highest increase was recorded by Selangor & Wilayah Persekutuan Putrajaya (2.4%) followed by Pahang (2.3%), Terengganu (2.2%), Kelantan (2.1%), Johor (1.8%) and Perak (1.8%). (Chart 3)
The increase was mainly due to the higher prices of chicken, eggs, cooking oils and fish & seafood in 2021 as compared to the preceding year. Meanwhile, other states showed an increase below the national inflation of Food & Beverages rate of 1.7 per cent in 2021.

The full publication of the Analysis of Annual Consumer Price Index 2021 can be download from eStatistik portal.
Released By:
THE OFFICE OF CHIEF STATISTICIAN MALAYSIA
DEPARTMENT OF STATISTICS, MALAYSIA
1 June 2022
Contact person:
Mohd Yusrizal Ab Razak
Public Relation Officer
Strategic Communication and International Division
Department of Statistics, Malaysia
Tel : +603-8885 7942
Fax : +603-8888 9248
Email : yusrizal.razak[at]dosm.gov.my

 Contact Us
 FAQs
FAQs Feedback
 Sitemap